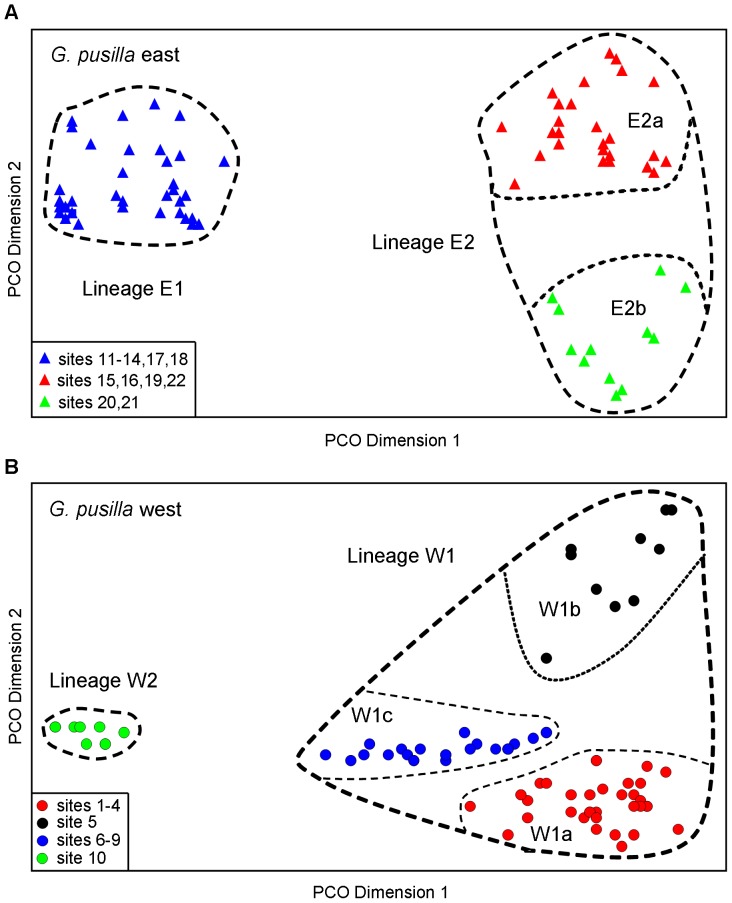
Figure 5. Principal coordinates analyses of Galaxiella pusilla.
PCO for all 100 G. pusilla east (A) and all 82 G. pusilla west (B) individuals. Relative PCO scores are plotted for the first and second dimensions, which individually explain 41% and 10% (A) and 25% and 17% (B) respectively of the total multivariate variation present. Individuals are colour-coded relative to Figs. 1, 2 and 3.

