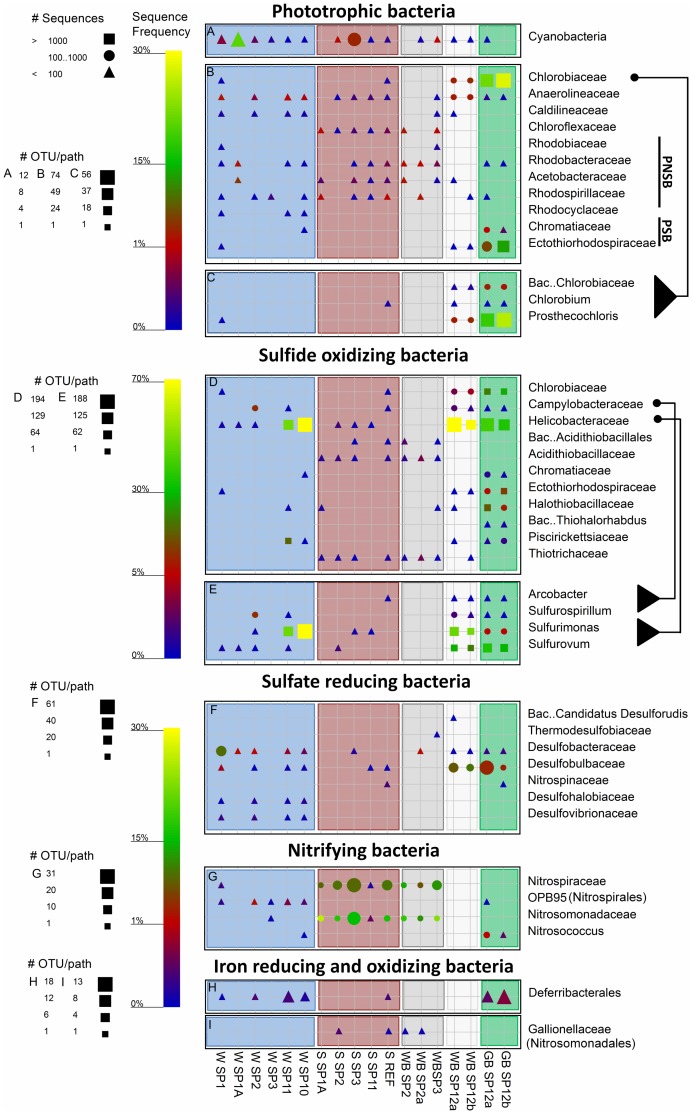
Figure 9. Graphical representation of the sequence frequency in the studied Dead Sea samples, showing major detected phyla and families of different functional groups of Bacteria.
PSB and PNSB in panel B refer to purple sulfur and non sulfur bacteria, respectively. The different genera within the families Chlorobiaceae,Campylobacteraceae and Helicobacteraceaeare shown to facilitate a more specific sample comparison. The symbols and sample naming are explained in detail in Fig. 8. Note different legends for OTU/path for each panel, and scale-bars for relative sequence frequency for several combined panels.

