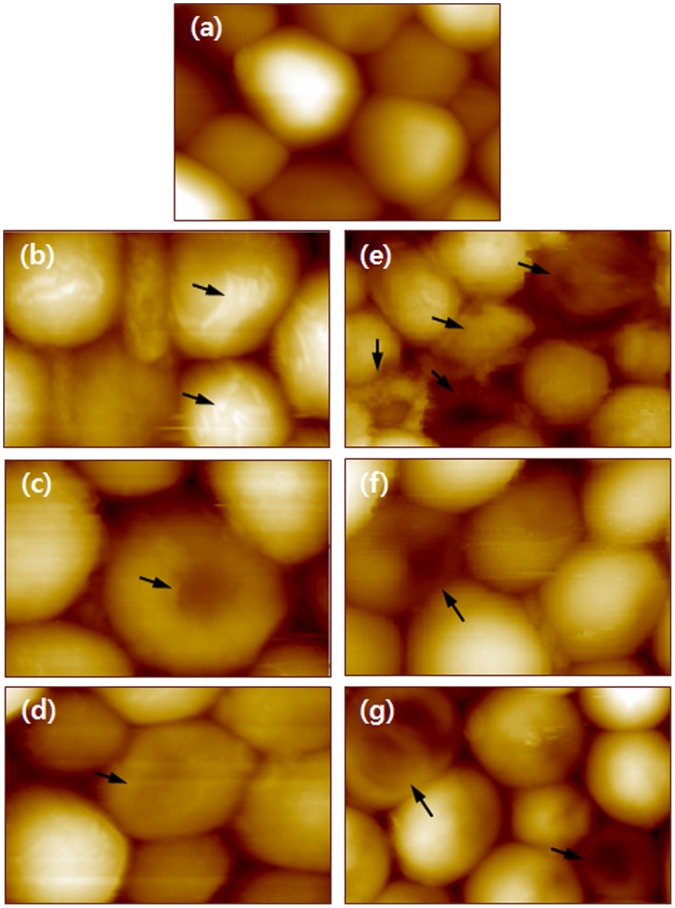
Figure 3. AFM images of C. albicans treated with allicin or antifungal drugs for 24 hours.
(a) Control cells. The images shown in (b) – (g) are of cells treated with allicin alone, AmB, flucytosine, AmB + allicin, flucytosine + allicin, and AmB + flucytosine + allicin, respectively. The arrows indicate significant morphological changes.

