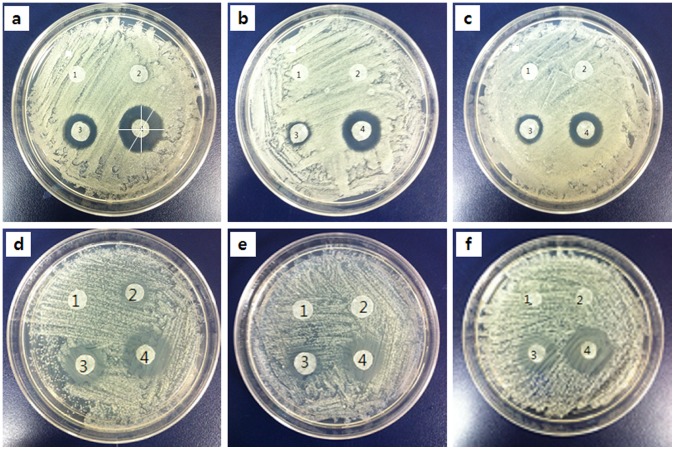
Figure 4. Clearing assays with AmB (a), flucytosine (b), allicin (c), AmB + allicin (d), flucytosine + allicin (e), and AmB + flucytosine + allicin (f).
Spot number 1 indicates the control sample. The spots numbered 2, 3, and 4 correspond to antifungal treatments with the concentrations of MIC10×10−1, MIC10, and MIC90, respectively.

