
Figure 3. Frequency comparison of CRH-induced and endogenous glucocorticoid oscillations.
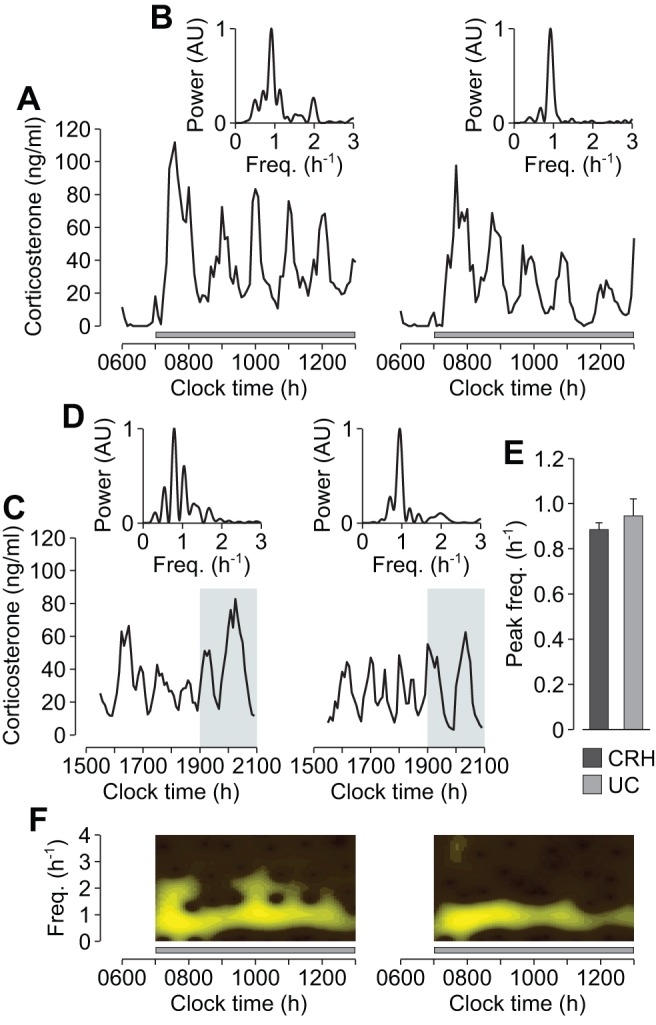
(A) Individual corticosterone oscillations in response to constant CRH infusion (0.5 µg/h). Grey bar indicates the period of infusion. (B) Normalized power spectra of the corticosterone oscillations in (A). (C) Corticosterone oscillations during the circadian peak in untreated control (UC) rats. Shaded region indicates the dark phase. (D) Normalized power spectra of the corticosterone oscillations in (C). (E) Mean peak frequency (i.e., frequency corresponding to the maximum power in the spectrum) of corticosterone oscillations in response to constant CRH infusion (0.5 µg/h; CRH; n = 6), and of corticosterone oscillations during the circadian peak in untreated control rats (UC; n = 13). Error bars represent mean ± standard error of the mean (SEM). (F) Frequency evolution of the corticosterone oscillations in (A). AU, arbitrary units.