
Figure 4. ACTH and glucocorticoid response to constant CRH infusion.
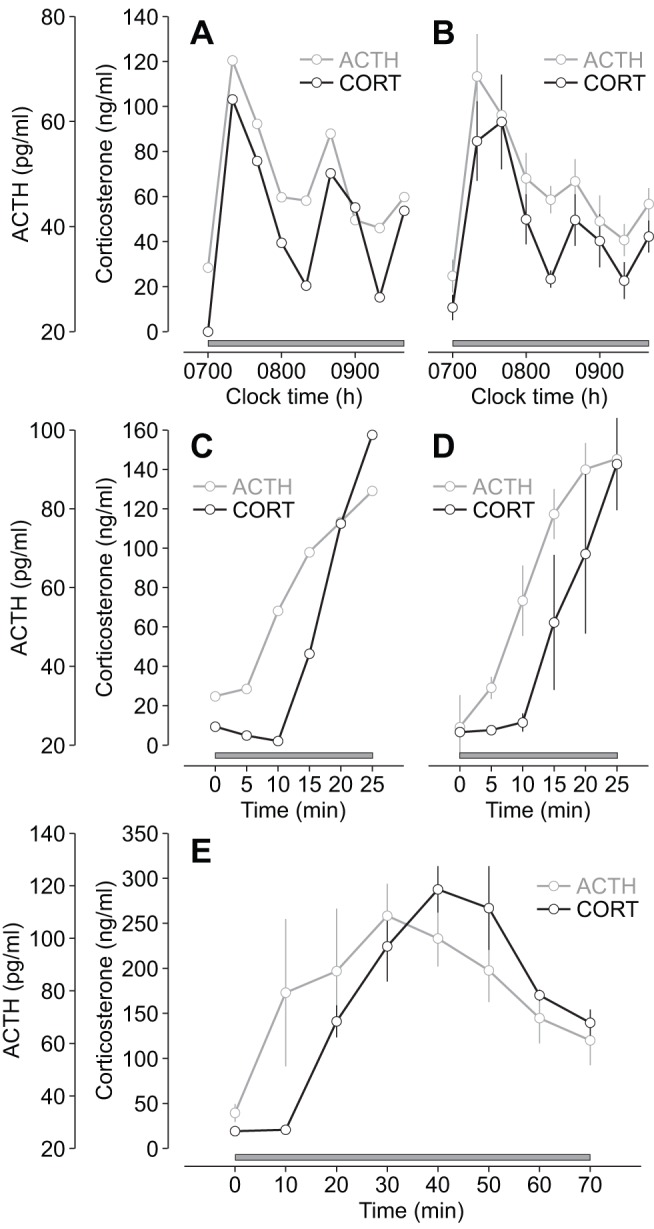
(A–B) Individual (A) and mean (B) ACTH and corticosterone (CORT) oscillations in response to constant CRH infusion (0.5 µg/h; n = 6). (C–D) Individual (C) and mean (D) time course of the ACTH and corticosterone (CORT) response to constant CRH infusion (0.5 µg/h) during the initial activation phase (0–25 min) of the oscillation (n = 4). There was a significant overall effect of the CRH infusion on both ACTH and corticosterone (ACTH, p<0.0001; corticosterone, p<0.005; one-way ANOVA). ACTH was significantly different from basal (time zero) by 10 min (p<0.005), whereas corticosterone was not significantly different from basal (time zero) until 20 min (p<0.05). (E) Phase-shifted ACTH and corticosterone (CORT) response to constant CRH infusion (0.5 µg/h) over the duration of the first pulse (n = 3–7 per time point). Grey bar indicates the period of infusion (starting at 0700 h); error bars represent mean ± standard error of the mean (SEM).