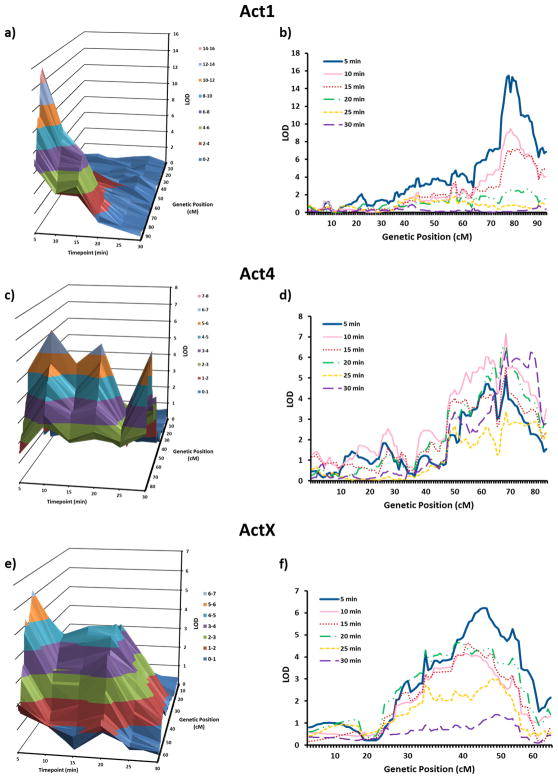
Figure 3.
Time-dependent nature of baseline locomotor activity QTLs. a) 3D plot of the integrated QTL results for the Act1 QTL across time-point (depth axis), genetic distance (horizontal axis) and LOD score (vertical axis) b) plot of 6 LOD curves, separated by time-point (0–5, 5–10, 10–15, 15–20, 20–25, 25–30) for the Act1 QTL. c) 3D plot of the integrated QTL results for the Act4 QTL across time-point (depth axis), genetic distance (horizontal axis) and LOD score (vertical axis). d) plot of 6 LOD curves, separated by time-point (0–5, 5–10, 10–15, 15–20, 20–25, 25–30) for the Act4 QTL. e) 3D plot of the integrated QTL results for the ActX QTL across time-point (depth axis), genetic distance (horizontal axis) and LOD score (vertical axis). f) plot of 6 LOD curves, separated by time-point (0–5, 5–10, 10–15, 15–20, 20–25, 25–30) for the ActX QTL.

