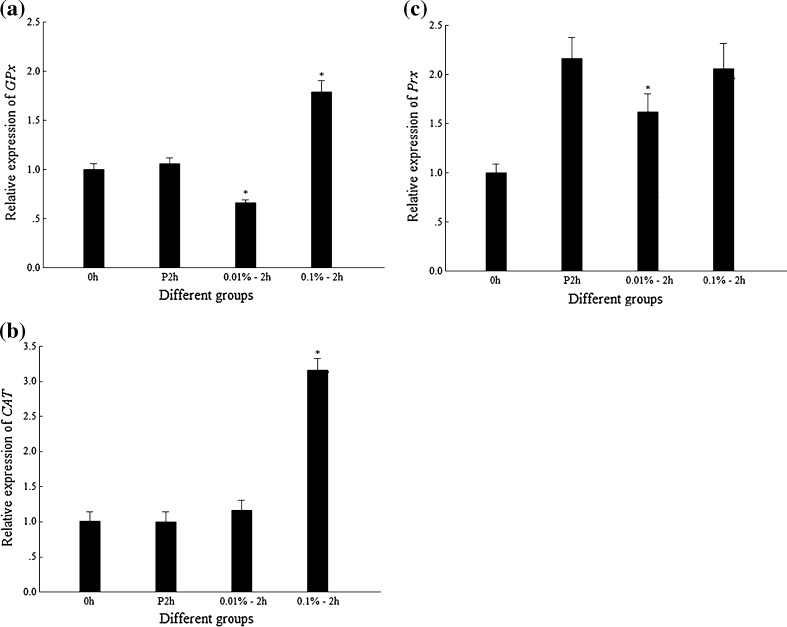
Fig. 2.
Transcriptional expression profiles of GPx, CAT, and Prx in shrimp after H2O2 injections. 0h blank group without any injection, P2h 2 hpi of PBS, 0.01%–2 h 2 hpi of 0.01% H2O2; 0.1%–2 h 2 hpi of 0.1% H2O2. Asterisk means that the difference between 0.01%–2 h or 0.1%–2 h and P2h group is statistically significant. a Expression profile of GPx. b Expression profile of CAT. c Expression profile of Prx

