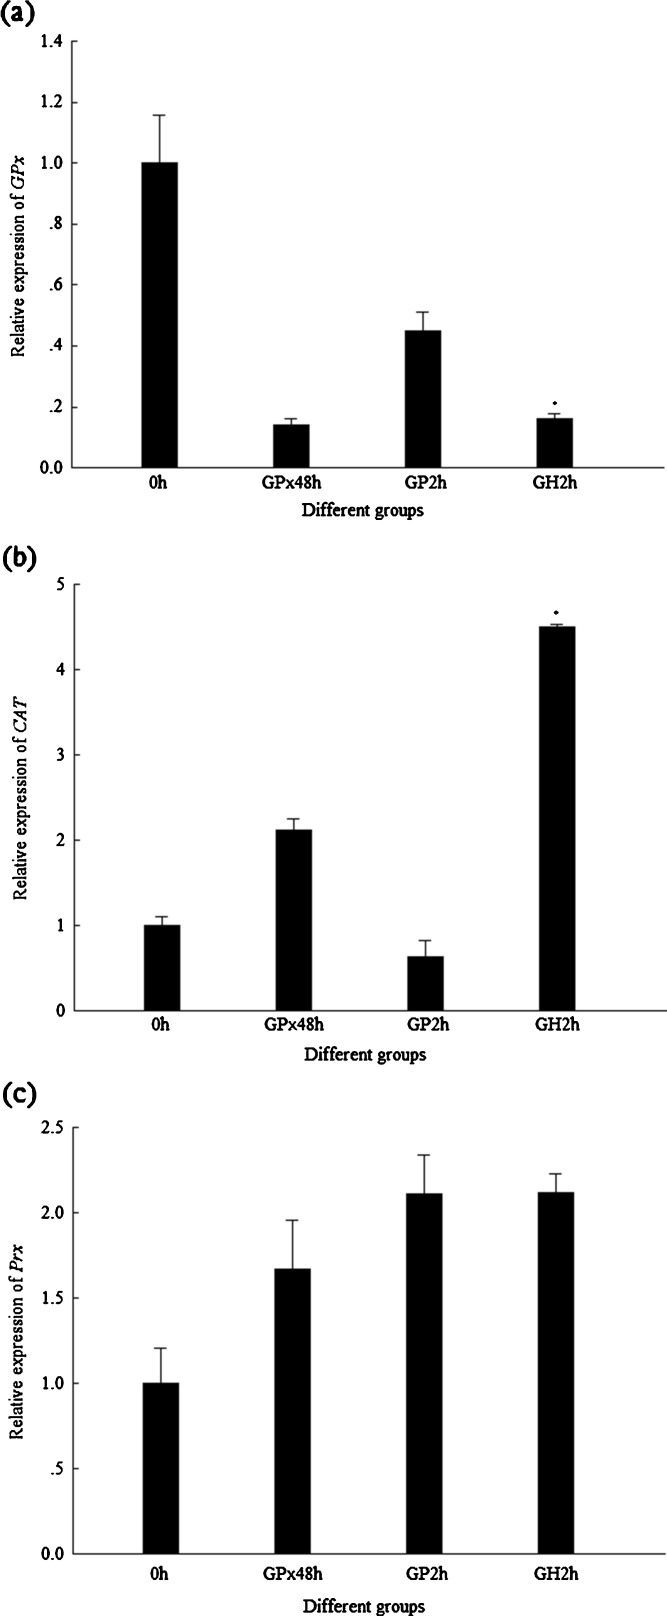
Fig. 9.
Transcriptional expression profiles of GPx, CAT, and Prx in DsGPx-silenced shrimp injected with 0.1% H2O2. GPx48h 48 hpi of DsGPx, GP2h 2 hpi of PBS after DsGPx silenced, GH2h 2 hpi of H2O2 after DsGPx silenced. Asterisk means that the difference between GH2h and GP2h is statistically significant. a Expression profile of GPx. b Expression profile of CAT. c Expression profile of Prx

