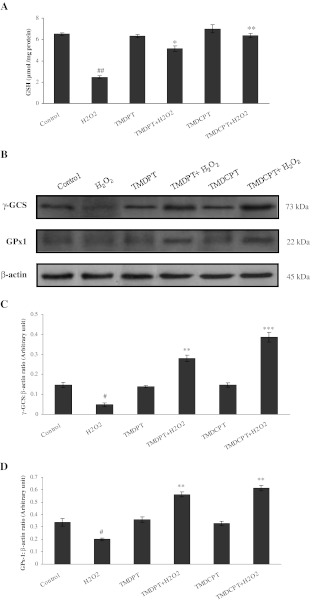
Fig. 5.
GSH, γ-GCS, and GPx1 levels in PC12 cells pretreated with TMDPT and TMDCPT. PC12 cells were pretreated with triazine derivatives (10 μM) for 3 h and then exposed to H2O2 for 24 h. a Glutathione level was measured by DTNB method. b Twenty-microgram proteins were separated on SDS-PAGE, western blotted, probed with anti-γ-GCS and anti-GPx1 antibodies, and reprobed with anti-β-actin antibody (one representative western blot was shown; n = 3). The densities of γ-GCS (c) and GPx1 (d) bands were measured and the ratio was calculated. The mean of three independent experiments is shown. #P < 0.05 and ##P < 0.01, significantly different from untreated cells. *P < 0.05, **P < 0.01, and ***P < 0.001, significantly different from H2O2-treated cells

