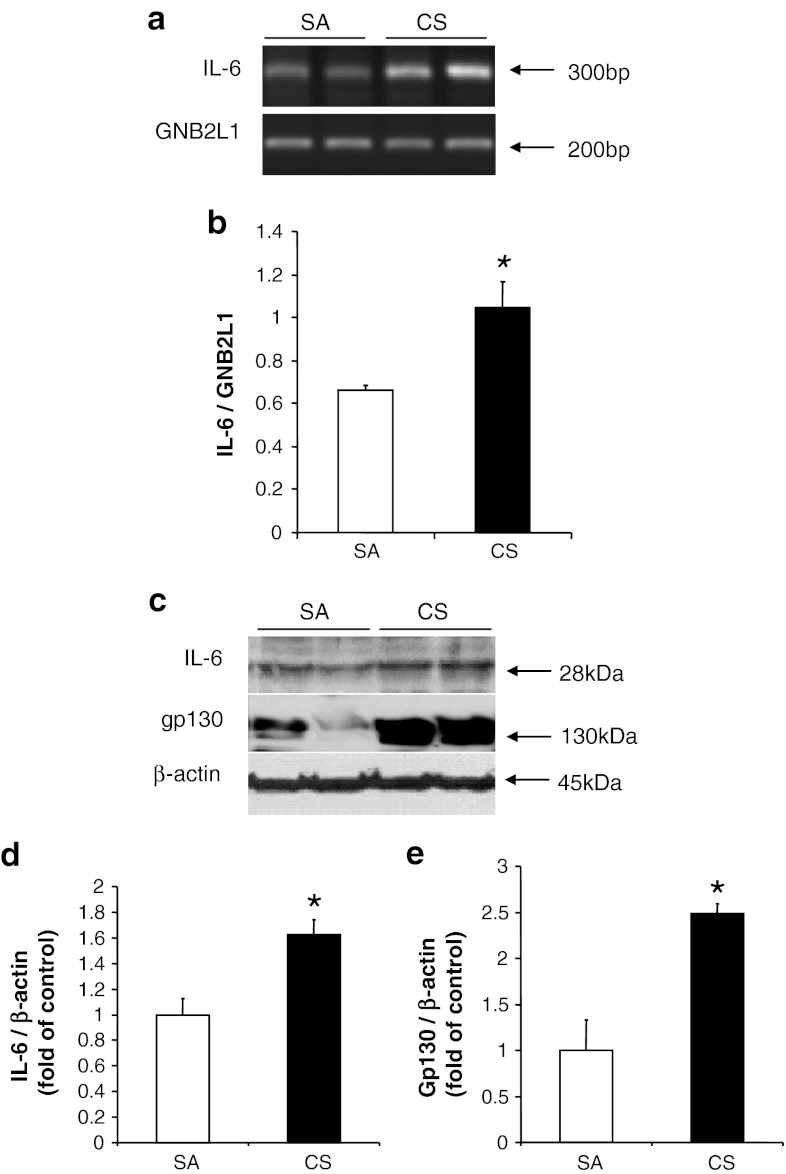
Fig. 1.
Induction of IL-6 in cortex after 56 days of CS exposure. a Expression of IL-6 mRNA, with GNB2L1 serving as an internal control. b Quantitative analysis of luminescent band intensity of IL-6. Results are expressed as IL-6 to GNB2L1 ratio. c Protein levels of IL-6 and gp130, with β-actin serving as an internal control. d, e Quantitative analysis of band intensity by densitometry. Values represent the mean ± SEM. *p < 0.05, when comparing between SA and 56 days of CS exposure groups (n ≥ 4)

