
Figure 3.
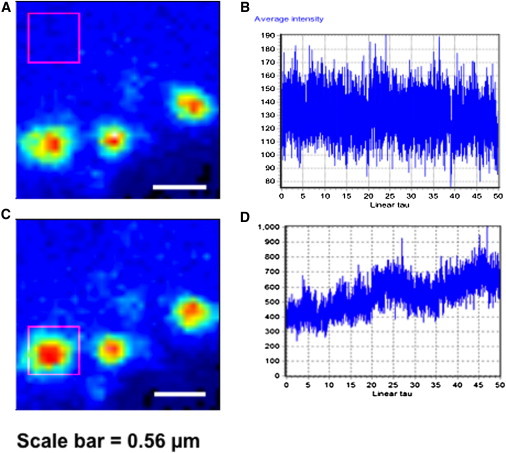
Recruitment of VP40 to the plasma membrane. Analysis of cytosolic and membrane regions of HEK293T cells expressing EGFP-VP40 were done with RICS. (A) Average image of cell showing region of analysis in the cytosol (pink box). (B) Intensity derivative plot obtained by analysis of intensity fluctuations in the cytosol with respect to time. The total scan time was 156 s and thus the x axis represents a total time of 156 s where linear tau represents time with 1 unit representing 3.12 s. (C) Average image showing region of interest at a plasma membrane VP40 bud site where three individual growing bud sites are shown. (D) Intensity plot with respect to time at the membrane. The total scan time was 156 s and thus the x axis represents a total time of 156 s where linear tau represents time with 1 unit representing 3.12 s.