
Figure 4.
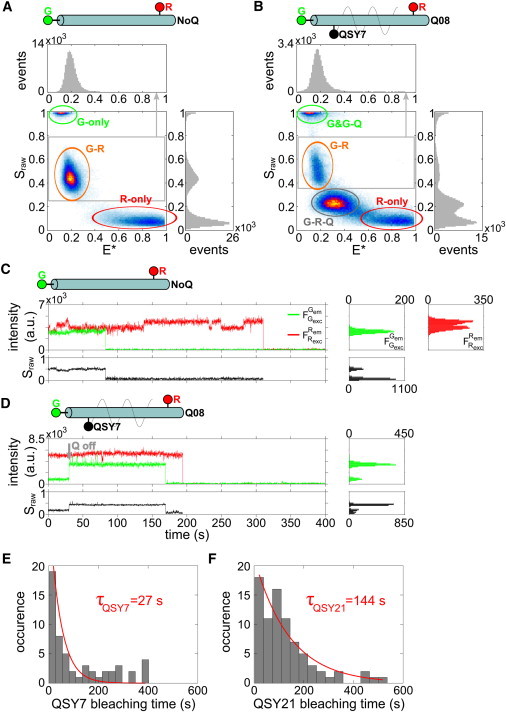
Single-molecule experiment results on immobilized DNA standards. (A and B) E∗-Sraw histograms of DNAs NoQ (A) and Q08QSY7 (B) from TIRF experiments. (C and D) Fluorescence time-traces ( and ) of DNAs NoQ (C) and Q08QSY7 (D). Time-traces of Sraw do not include data bins where both fluorophores are photobleached. The histogram of and Sraw are projected on the right side ( histogram is not shown). histograms do not include data bins after photobleaching. Bleaching of probe Q (Qoff, shaded arrow) is detected when probe G intensity switches from a low state to a high state, the mean intensity value of the low state being 75–85% lower than the high state that corresponds to ER→QSY7. When probe Q bleaches or blinks, Sraw switches from a low state (∼0.25) to a high state (∼0.5). (E and F) Histograms and fits of the bleaching lifetime distribution of the dark quenchers for DNAs Q08QSY7 (E) and Q08QSY21 (F). The histograms were fitted with a single-exponential decay function F (F (t) = A exp(− t/τQ)) with A and τQ the fitted parameters. The bleaching lifetimes for QSY7 and QSY21 are τQSY7 = 27 s and τQSY21 = 144 s, respectively.