
Figure 1.
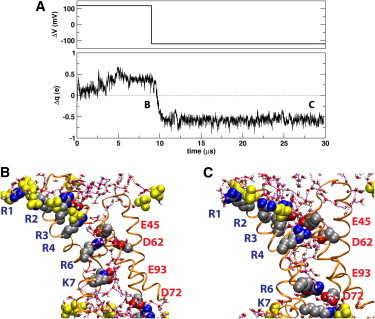
(A) (Upper panel) Time-dependence of applied membrane potential, ΔV, relative to the intracellular side of the membrane. (Lower panel) Total charge displacement within the membrane electric field with respect to the initial configuration. Switching the membrane potential from a depolarizing to a hyperpolarizing potential after 9 μs produces ∼1e of net gating charge. (B and C) Snapshots of the VSD at two membrane potentials: (B) Depolarized (ΔV = 120 mV) VSD after 8.5 μs. R4–K7 are shifted outwards with respect to the unpolarized trajectory. (C) Hyperpolarized (ΔV = –120 mV) VSD after 28.35 μs. The labels in panel A indicate the location of the snapshots within the trajectory. The VSD is shown in secondary structure representation. The conserved charged side chains (shown as filled spheres) are colored by atom type (carbon, silver; oxygen, red; nitrogen, blue). The labels (in blue) of the basic side chains in S4 and the S4-S5 linker follow the order of the triplet repeats starting at the extracellular end (corresponding to R117, R120, R123, R126, R133, and K136 in the KvAP sequence). The conserved positions for acidic side chains are labeled (in red) according to the KvAP sequence. An additional acidic side chain (E107) that forms a persistent salt-bridge with R3 is also shown. Lipid phosphate groups in the first coordination shell of the protein (filled yellow spheres). Water molecules in the first coordination shell of the protein are shown in licorice representation colored by atom type (hydrogen, white). Water-water hydrogen bonds are drawn as broken lines. For clarity, the hydrogen atoms in the protein side chain are not shown.