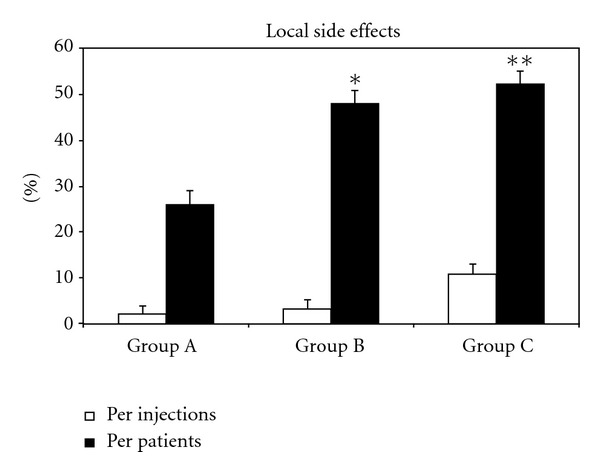
Figure 1.

Frequency of local side effects in three groups of patients treated according to different venom immunotherapy (VIT) protocols (see Methods for treatments). Results are shown per injections (□) and per patients (▪). Each bar represents the mean ± SEM. *P < 0.05 compared with the corresponding group A versus group B. **P < 0.001 compared with the corresponding group A versus group C.
