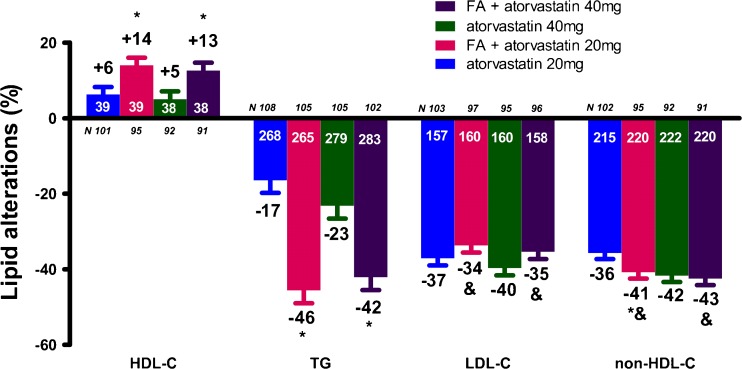
Fig. 3.
Lipid alterations (%) with the combination of fenofibric acid (FA) 135 mg/day with atorvastatin compared with atorvastatin alone [23]. *p < 0.05 vs. corresponding statin dose. & p < 0.05 vs. FA monotherapy. Bars represent mean ± SEM. The numbers with white color represent the baseline values, whereas the numbers with black color represent the percent changes. HDL-C = high-density lipoprotein cholesterol, TG = triglycerides, LDL-C = low-density lipoprotein cholesterol

