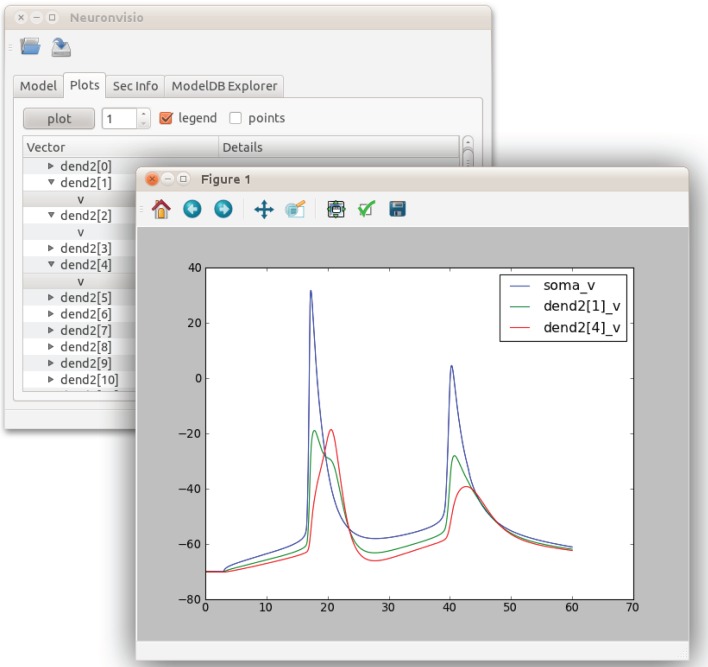
Figure 3.
Matplotlib integration in Neuronvisio. The graph shows the time courses of the depolarization of the pyramidal Neuron, using the model from Mainen et al. (1995). The voltage of soma is plotted in blue, while two dendrites are plotted in red and green. The voltage (y-axis) is in millivolts and the time (x-axis) is in milliseconds.

