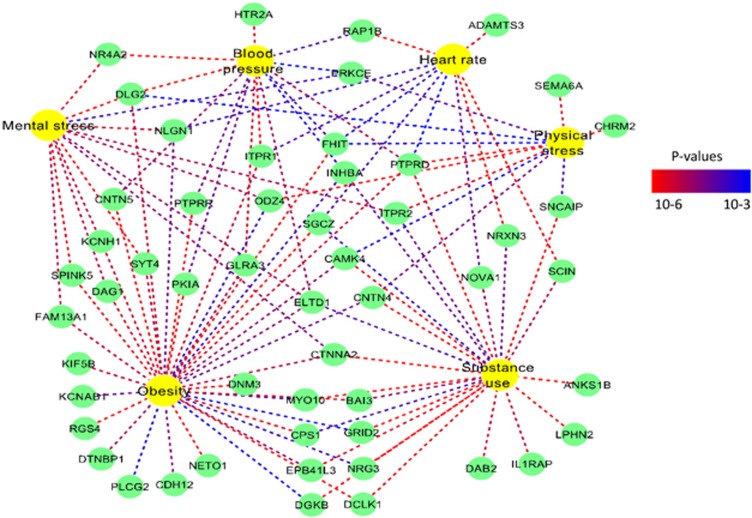
Figure 1.
Overview of the identified genes that have synaptic function. Trait nodes are yellow, and gene nodes are green. The edges are colored in a heat scale according to the strength of the association (P-values). A full color version of this figure is available at the Hypertension Research journal online.

