Figure 10.
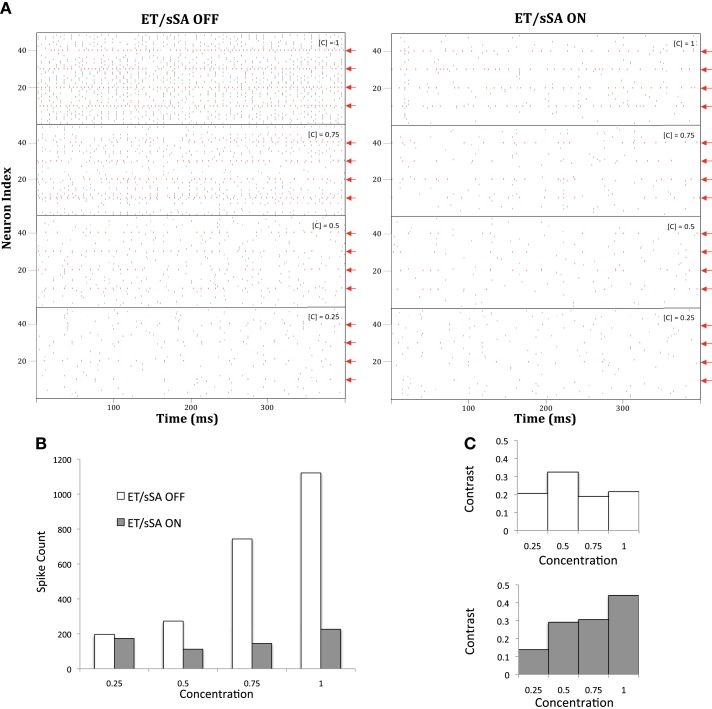
(A) With the ET/sSA network off, mitral cell population activity increases monotonically in proportion to input intensity (odor concentration, [C]). The spikes of those mitral cells that are most sharply tuned to the presented odor are depicted in red and indicated by red arrows; additional, weakly activated mitral cells also are recruited in to the active ensemble as concentration increases. With the ET/sSA network on, aggregate mitral cell population activity remains largely independent of concentration. Odor identity is represented by the profile of the most sharply tuned mitral cells, and their relative activities remain essentially stable after normalization. (B) Quantification of the normalizing effect of the ET/sSA network. Spiking activity of mitral cells that are moderately or poorly tuned to a given stimulus (i.e., the count of all black marks in the raster of (A), excluding the spikes from sharply tuned neurons as denoted in red) was plotted against odor concentration. The inhibitory effects of the ET/sSA network limit or prevent firing in more weakly tuned mitral cells, such as those that are recruited only at higher odor concentrations. At high concentration the normalizing effects reduce the spike count by as much as 80%. (C) Effects of ET/sSA network normalization on contrast enhancement. Contrast was calculated as the total number of spikes in the most strongly tuned neurons divided by the total number of spikes in the population. With the ET/sSA network disconnected (top), the recruitment of weakly tuned mitral cells by elevated odor concentrations prevents improvements in contrast across mitral cell population activity. With the ET/sSA network active (bottom), increases in concentration result in net inhibition of marginally activated neurons, increasing the contrast between them and the most strongly activated neurons.

