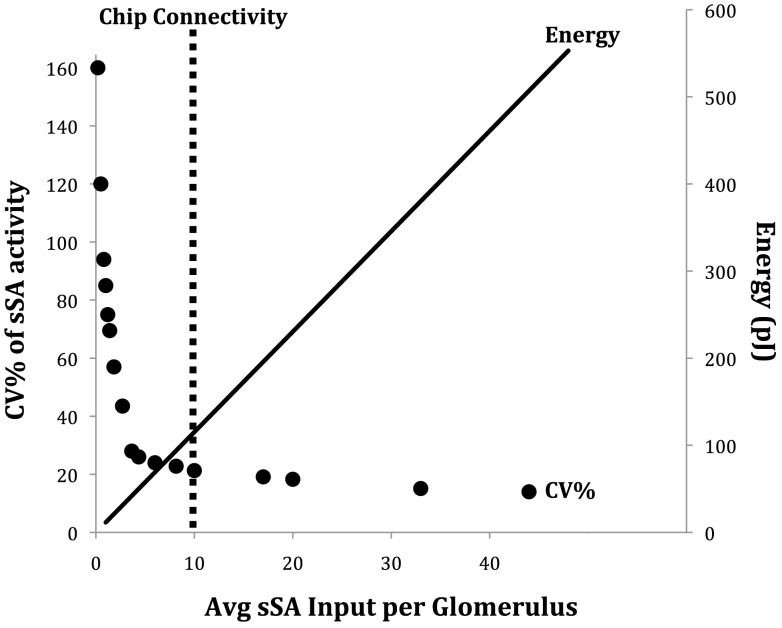
Figure 11.
The sparse connectivity of the ET/sSA network on the chip is functionally equivalent to a fully connected network, but carries out global normalization at a reduced energy cost. The abscissa is a measure of the density of sSA connections, bounded by the extremes of a fully isolated network at x = 0 and an all-to-all interconnected network at x = 48. The primary ordinate (left) denotes the coefficient of variation (CV% – the standard deviation as a percentage of the mean) of sSA activity across the sSA population. Low CVs indicate high uniformity in sSA activity across the network. The secondary ordinate (right) denotes the energy consumed in the chip (at its present scale) by updating all synaptic inputs when sSA neurons spike. Denser interconnectivity requires more energy. The dotted vertical line denotes the density of sSA innervation presently implemented in the chip. This reasonably optimized solution corresponds directly to that which appears to be implemented in mouse and rat olfactory bulbs (cf. Figure 5B in Cleland et al., 2007).

