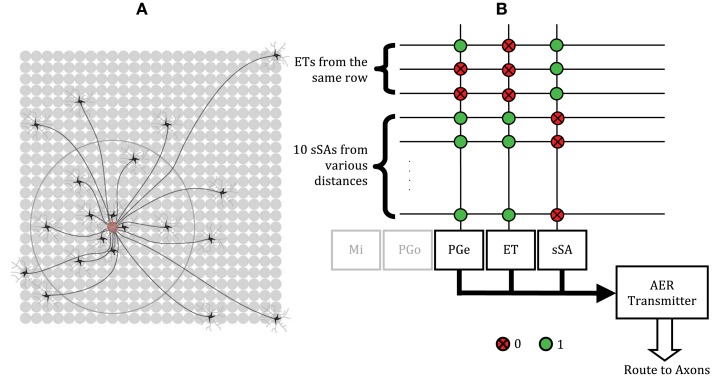
Figure 6.
Normalization of the total activity of mitral cells via the ET/sSA network. (A) Illustration of the lateral connectivity of sSA cells. Glomeruli receive inputs from the axons of multiple sSA neurons located at a characteristic distribution of distances away. These axons branch extensively, although for clarity this is not shown. The sSA neurons receive synaptic input from ET cells in a small number of immediately neighboring glomeruli (depicted as the gray dendrites of the black sSA cells). Figure adapted from Cleland (2010). (B) Crossbar connectivity in the chip to replicate the normalization effects of the ET/sSA lateral network. Each sSA neuron receives input from ET cells from the same row. The PGe and ET neurons of each of the 48 columns receive input from 10 sSA neurons, most of which are located in neighboring rows, but some of which are more than five rows away. Spikes generated by an sSA neuron are routed to its axon in the crossbar which synapses with the PGe and ET cells of 10 different glomeruli. The outputs of the PGe and ET neurons also are routed to their axons in order to make the appropriate inter- and intra-glomerular connections (see Figure 1).

