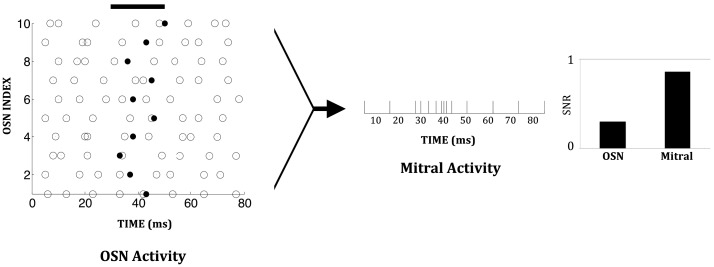
Figure 7.
Chip data illustrating the enhanced signal-to-noise ratio (SNR) in a mitral cell compared to an OSN. A constant low-concentration odor was presented between 30 and 50 ms (solid black line). This increases the spiking probability of individual OSNs during one time step (1 ms) from 0.1 to 0.15. Background spiking is depicted by open circles; additional odor-evoked spikes are depicted by solid black dots. Since multiple OSNs converge on one mitral cell, mitral cell activity during the stimulus period exhibits a significant increase over its background level. The signal-to-noise ratio in an OSN is 0.3 while that in the mitral cell is 0.8.

