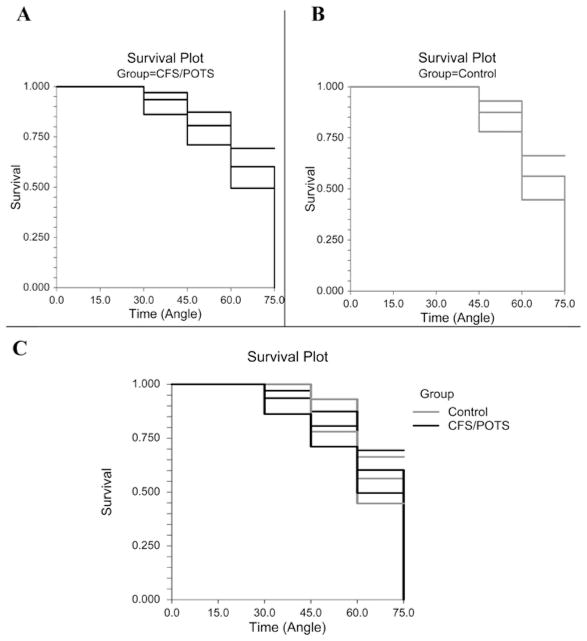
Figure 1. Survival analysis with 95 % CIs during graded tilt between CFS/POTS (black) and control (grey) subjects.
(A) The survival curve for the CFS/POTS subjects shows that the greatest amount of subject dropout occurred at 60° and 75°. (B) The survival curve for the control subjects shows that the greatest amount of subject dropout occurred at 60° and 75°. (C) The survival curve comparing CFS/POTS and control subjects shows that there was no difference between groups (P = 0.91).

