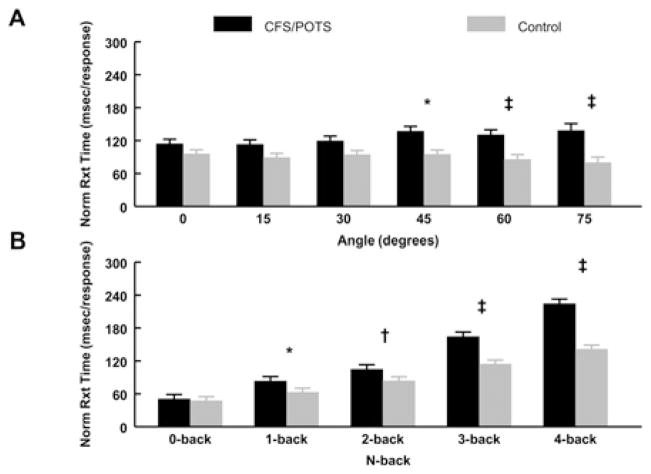
Figure 3. nRT during graded tilt and the n-back tasks between CFS/POTS (black) and control (grey) subjects.
(A) The analysis of group and angle showed that CFS/POTS had a greater nRT than controls at 45°, 60° and 75°. (B) The analysis between group and n-back showed that CFS/POTS had a greater nRT than controls during the 1-, 2-, 3- and 4-back. Values are means ± S.E.M. *P < 0.05, †P < 0.01 and ‡P < 0.001.

