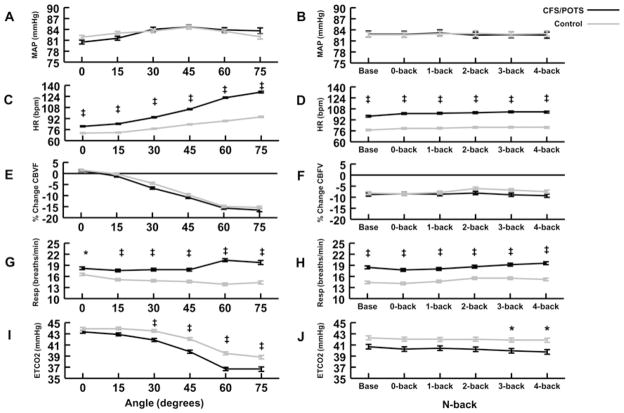
Figure 4. Physiological changes during graded tilt and the n-back tasks between CFS/POTS (black) and control (grey) subjects.
(A) MAP was not different between groups as angle increased. (B) MAP was not different between groups as the n-back difficulty level increased. (C) HR was high in CFS/POTS subjects at all angles compared with control subjects. (D) HR was higher in CFS/POTS subjects at baseline and all n-back difficulty levels compared with control subjects. (E) The percentage change in CBFV was not different between groups as the angle increased. (F) The percent change in CBFV was not different between groups at baseline and as the n-back difficulty level increased. (G) Respiratory rate (Resp) was higher in CFS/POTS subjects at all angles compared with control subjects. (H) Respiratory rate was higher in CFS/POTS subjects at baseline and all levels of n-back difficulty. (I) ETCO2 was lower in CFS/POTS subjects at 30°, 45°, 60° and 75° compared with control subjects. ETCO2 was lower in CFS/POTS subjects at the 3- and 4-back n-back difficulty levels compared with controls. Values are means ± S.E.M. *P < 0.05 and ‡P < 0.001.

