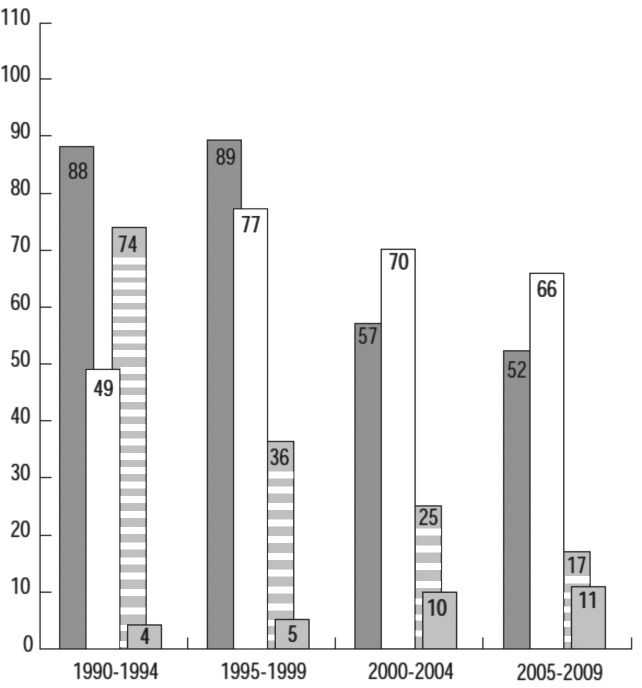
Figure 3.
Number of new chemical or biological entities (1990-2009). Source: SCRIP-EFPIA calculations (according to nationality of mother company), reproduced with permission from The Pharmaceutical Industry in Figures, EFPIA, 2010 edition (2). Europe – dark gray; USA – white; Japan – horizontal lines; others – light gray.

