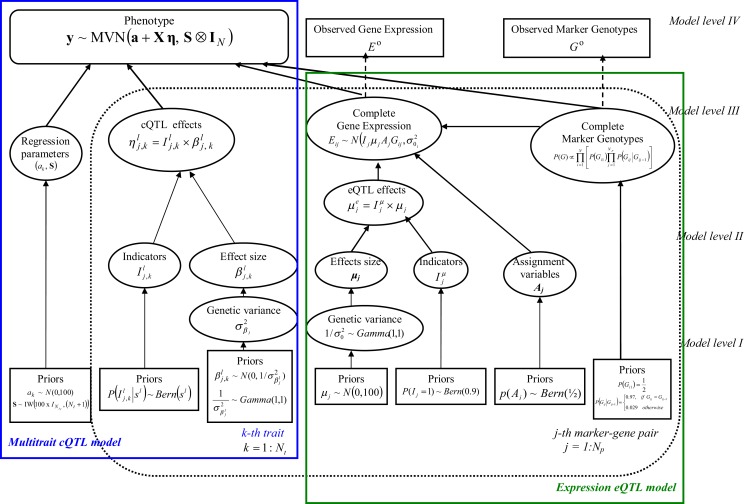
Figure 1.
Hierarchical directed acyclic graph (DAG) of the model structure. The pre-specified values (Model level I) or observed data (Model level IV) are given in boxes. Ellipses (Model levels II and III) refer to the unknown random variables, which are sampled. The solid arrows illustrate hierarchical dependencies, and the dotted arrows show deterministic dependences. The box given in bold indicates the multi-trait model structure.

