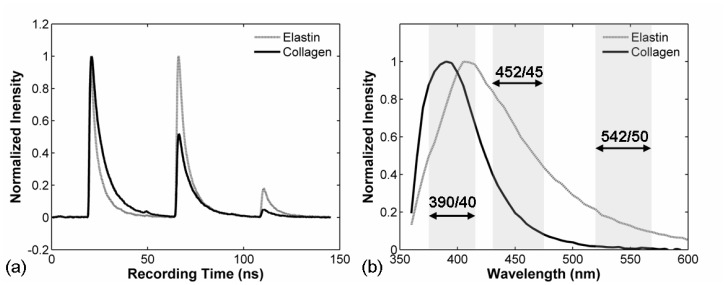
Fig. 2.
Measurement of biomolecules elastin and collagen: (a) fluorescence decay profiles and intensity recorded simultaneously at three wavelengths sub-bands (F1, F2, F3) measured within 200 ns. (b) Spectra of the same elastin and collagen samples excited by 337 nm laser measured with a scanning TR-LIFS device [16] and the corresponding sub-bands for F1(390/40), F2(452/45), and F3(542/50) nm filters.

