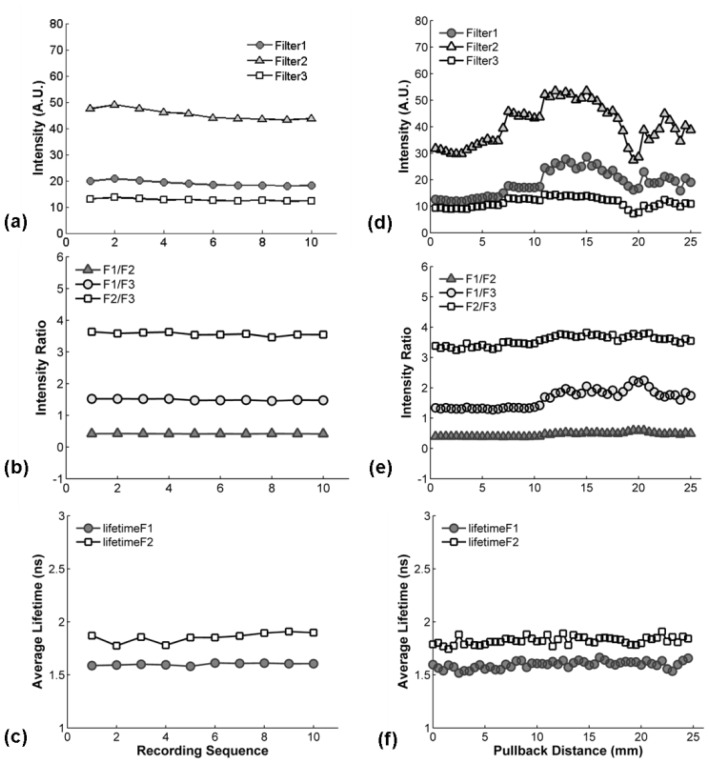
Fig. 5.
In vivo test of STWRFS in pig femoral artery: (a), (b), and (c) are the data in still mode − the probe was held at the same location (~1 second) for multiple measurements. (d), (e), and (f) are the results from a pull-back measurement when the catheter was gently moved along the axial direction for 25 mm. (a) and (d) show fluorescence intensity for the three filters, (b) and (e) display the intensity ratios, and (c) and (f) show the lifetimes.

