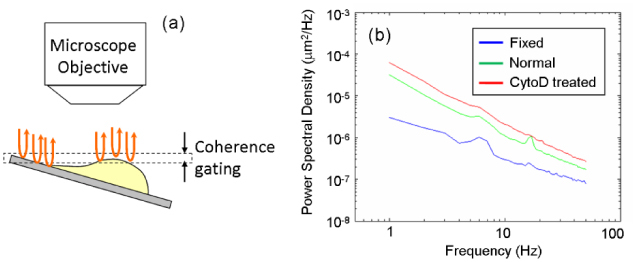
Fig. 5.

Setup and results of the cell membrane fluctuation measurement. (a) Location of coherence gate; the sample is tilted to simultaneously acquire membrane fluctuations as well as background phase from the coverslip. (b) Power spectral density of membrane fluctuations as a function of frequency for three different populations: blue, formalin fixed; green, normal; and red, Cytochalasin-D treated HeLa cells.
