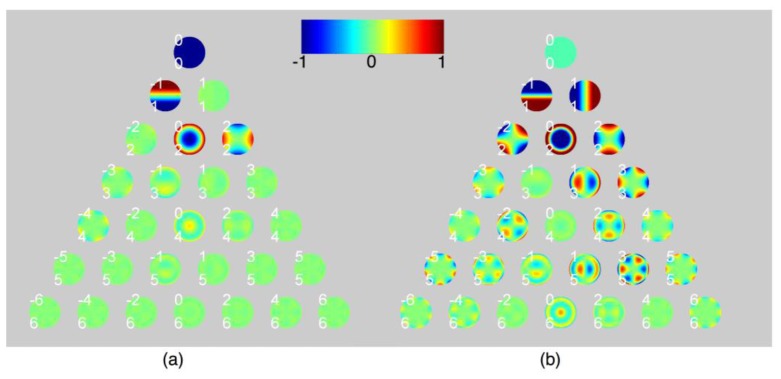
Fig. 8.
The Zernike coefficients for (a) the baseline data and (b) the TBU data. The colors represent the WFE. The saturation of the colors represents the magnitude of the Zernike aberration coefficients. The TBU data indicate an increase in the amount of HOA. RMS errors for the macro-aberrations were calculated with the modal wavefront: (a) 0.50 micron, (b) 1.97 micron.

