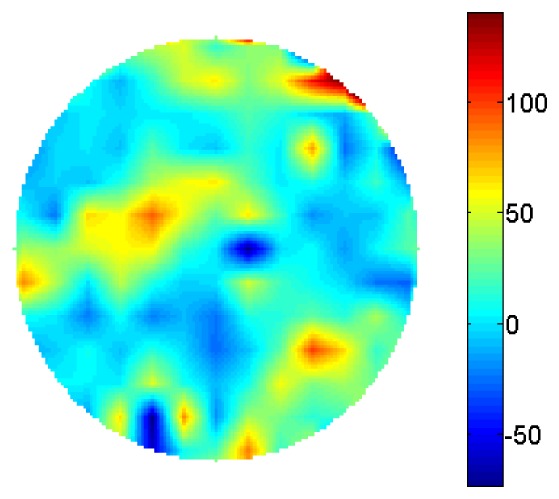
Fig. 11.

The difference of the radial variance maps for the light scatter between the baseline and TBU data. This map is computed by subtracting Fig. 10(a) from Fig. 10(b) in order to see the optical changes of light scatter caused by the event such as TBU. Some regions have become negative, which indicates that the light scatter could potentially be reduced during the TBU.
