Fig. 1.
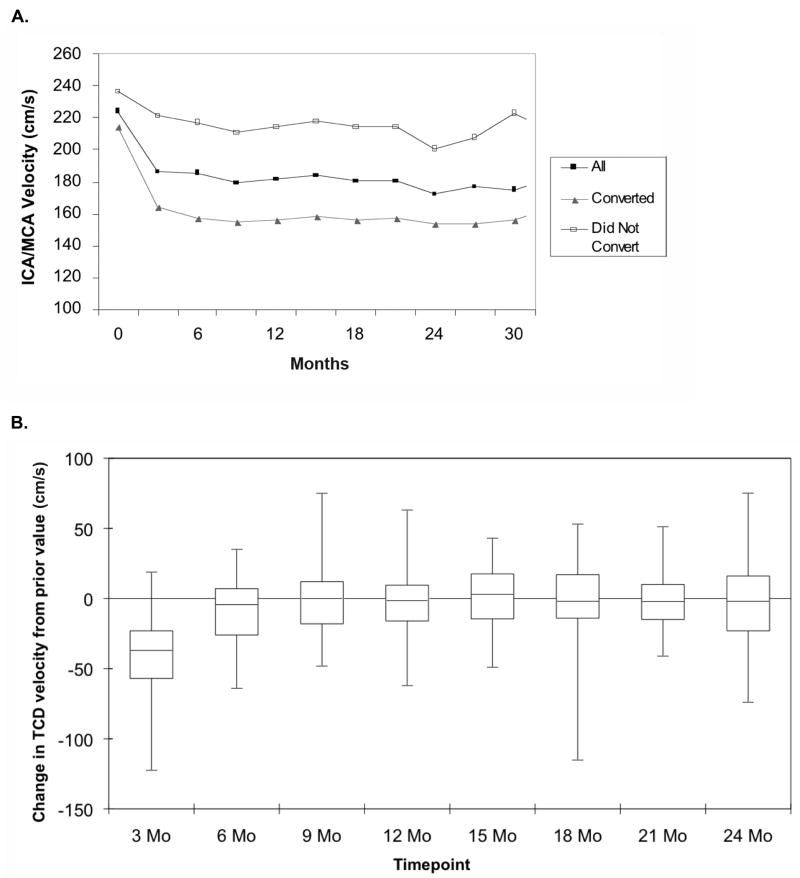
(A) The change in TCD velocity following initiation of transfusion therapy for abnormal TCD is shown for all children (■), children who converted to normal TCD (▲) and children who never converted to normal TCD (□). Follow-up was censored at the time of randomization into the STOP 2 trial (17 subjects). (B) The change in TCD velocity over time from the prior value (three months before) is shown in the box and whisker plot (N = 88).

