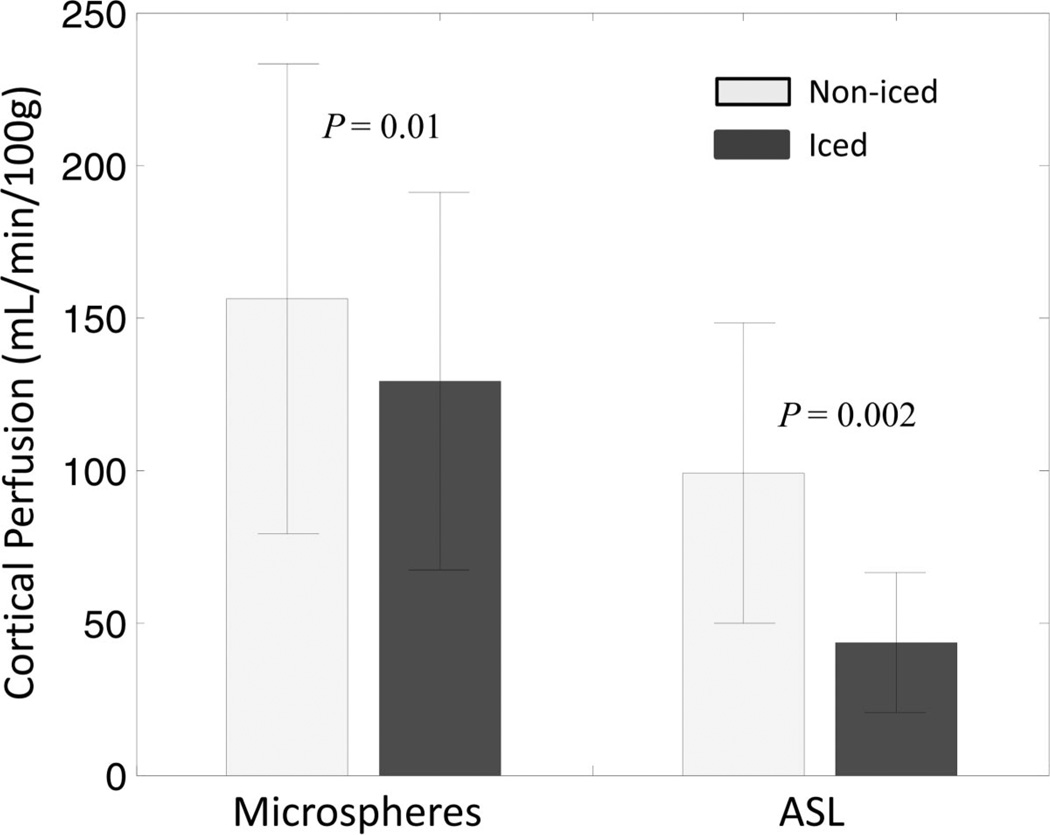
FIGURE 5.
Microsphere and ASL perfusion values in the noniced and iced kidneys averaged for 10 swine at the prolonged isoflurane time point. Error bars represent the standard deviation. Relative to the noniced kidneys, lower perfusion was detected in the iced kidneys with both microspheres (P = 0.01) and ASL (P = 0.002) as determined by a paired t test.

