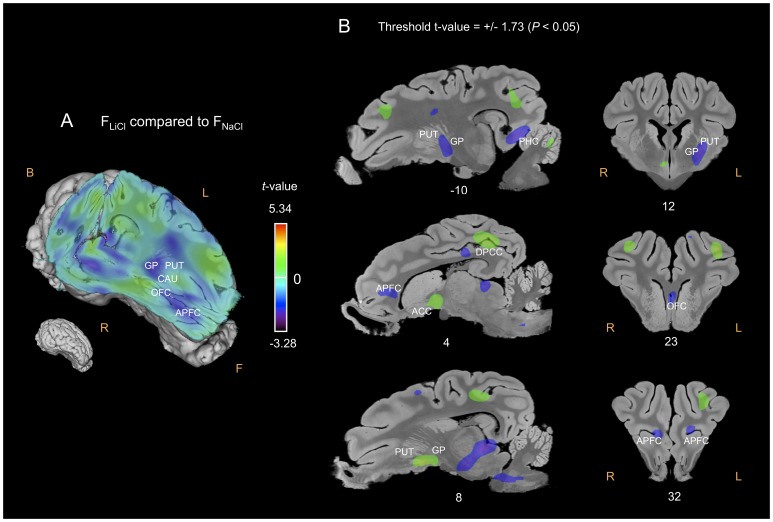
Figure 5. Cerebral glucose metabolism (CGM) differences obtained for the FLiCl flavour compared to the FNaCl flavour.
(A) Three-dimensional skinned representation of the pig’s brain with global CGM differences found in the FLiCl vs FNaCl contrast. The (x y z) coordinates are indicated below the representation. (B) Sagittal and coronal MRI sections showing significant CGM differences in the FLiCl vs FNaCl contrast. The threshold for significance was set at P<0.05 (uncorrected). The x or y coordinates are indicated below each section. Positive t-values (green, yellow and red) indicate more activation in the FLiCl condition than in the FNaCl condition, while negative t-values (blue and purple) indicate more deactivation in the FLiCl condition than in the FNaCl condition. F, Front; B, Back; R, Right; L, Left; APFC, anterior prefrontal cortex; OFC, orbitofrontal cortex; CAU, caudate nucleus; GP, globus pallidus; PUT, putamen; DPCC, dorsal posterior cingulate cortex.

