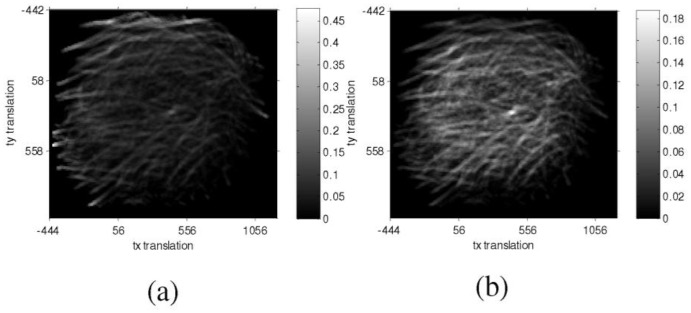
Fig. 4.
Estimation of translation parameters by similarity maps, where the x and y axes correspond to the translation differences along these axes. The side bars display the color map of similarities. (a) S1 similarity map, where the peripheral bright pixels are spurious peak similarities. (b) S similarity map with the correction term introduced, where the brightest pixel around at the center corresponds to the desired translation.

