
Figure 4.
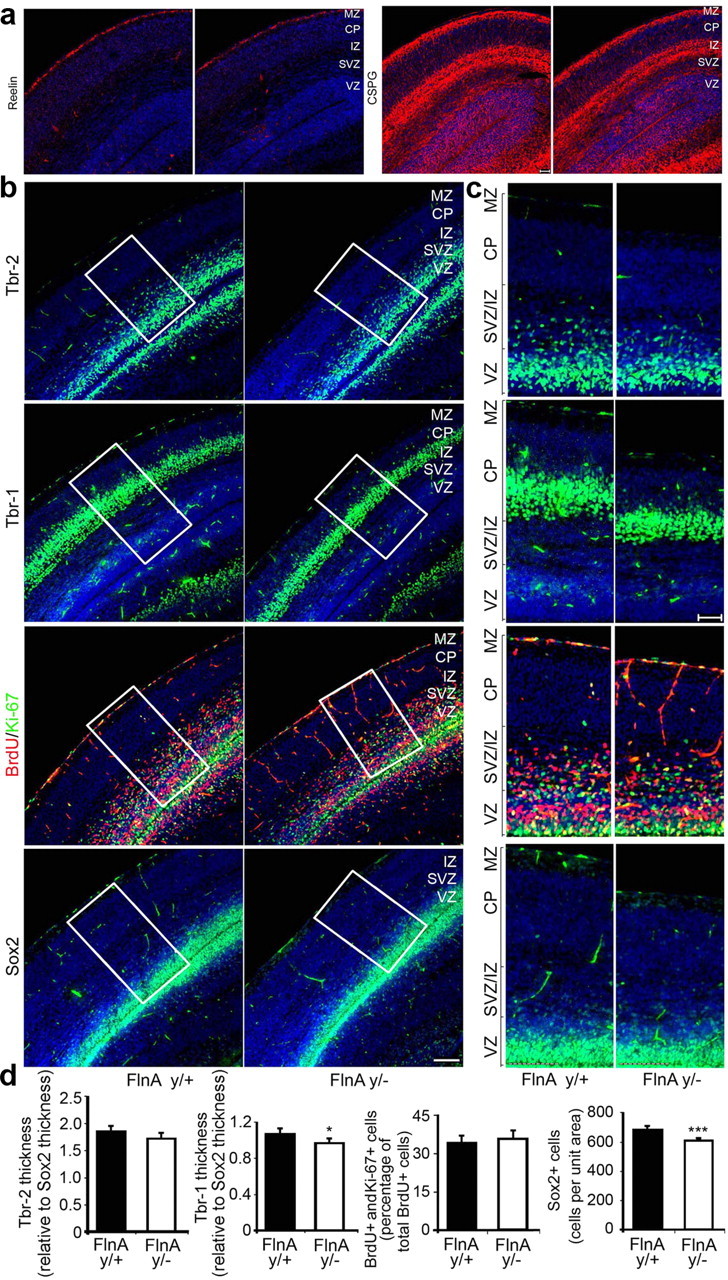
Diminished brain size in null FlnA mice is not due to an increase in neural differentiation. a, Relative rates of proliferation and differentiation of neural progenitors destined for both upper and lower cortical layers (corresponding to earlier and later born neurons, respectively) were identified after immunostaining of E18 brain sections with reelin and CSPG. Reelin served as a marker for the superficial marginal zone (molecular layer), whereas CSPG labeled both subplate and intermediate zone neurons. Staining for either of these markers was reduced or unchanged in the FlnAy/− cortex, suggesting no increase in early differentiation. b, Immunostaining for Tbr-2 (fluorescein, top), a differentiating progenitor marker, and Tbr-1 (fluorescein, second row), an earlier born neuronal marker, indicates a decrease in the width of the cortical layers and therefore decreases in the number of earlier born neurons in the FlnAy/− cortex compared to WT. Costaining for Ki-67 (fluorescein) and BrdU (rhodamine) demonstrated an increase of ∼3% in the relative number of proliferating progenitors in the FlnAy/− brain, consistent with a decreased rate of differentiation; immunostaining of Sox2 (fluorescein, fourth row), a progenitor marker, indicates a declination of neural progenitor amount in FlnAy/− cortex. c, Higher-magnification photomicrographs of the images in b demonstrated the reduction in the staining of the various differentiation markers. d, Quantification of the images is shown below. Statistical analyses were performed on serial sections from n > 3 brains per experimental variable and demonstrated a decrease in labeled cells per unit area (relative to the number of Sox2-positive cells) by 5.5 and 4.2%, respectively, for Tbr-1and Tbr-2. The number of Sox2 progenitors was also decreased by ∼10% in the FlnAy/− cortex compared to control. Sections were counterstained with nuclear Hoechst (DAPI). MZ, Marginal zone; CP, cortical plate; SP, subplate. Scale bars: b, 100 μm; c, 50 μm. *p < 0.05; ***p < 0.001.