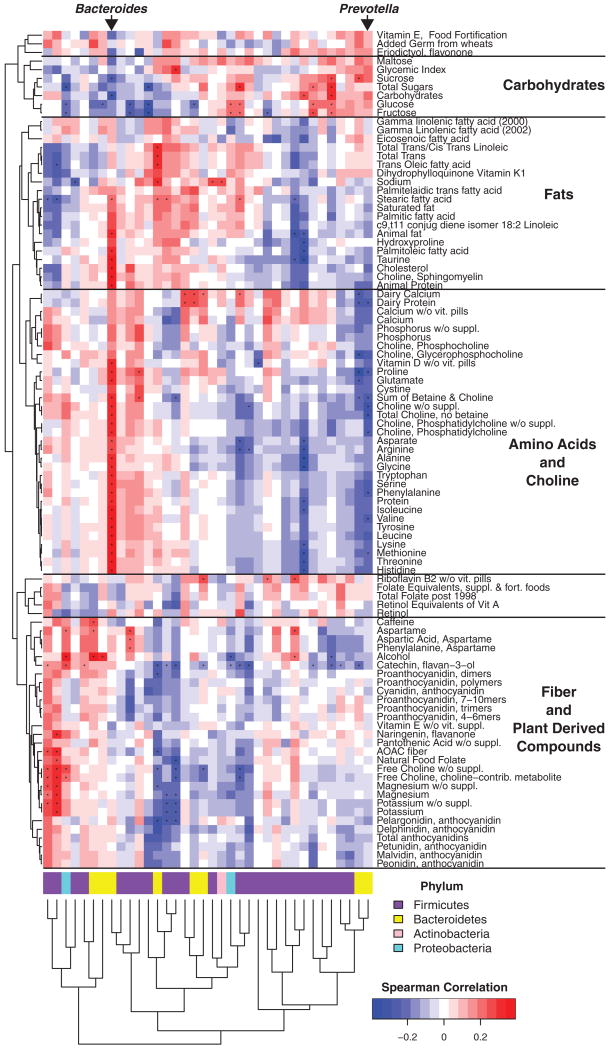
Fig. 1.
Correlation of diet and gut microbial taxa identified in the cross-sectional COMBO analysis. Columns correspond to bacterial taxa quantified using 16S rDNA tags; rows correspond to nutrients measured by dietary questionnaire. Red and blue denote positive and negative association, respectively. The intensity of the colors represents the degree of association between the taxa abundances and nutrients as measured by the Spearman's correlations. Bacterial phyla are summarized by the color code on the bottom; lower-level taxonomic assignments specified are in fig. S1. The dots indicate the associations that are significant at an FDR of 25%. The FFQ data were used for this comparison (both FFQ and Recall dietary data are shown together in fig. S1). Columns and rows are clustered by Euclidean distance, with rows separated by the predominant nutrient category.

