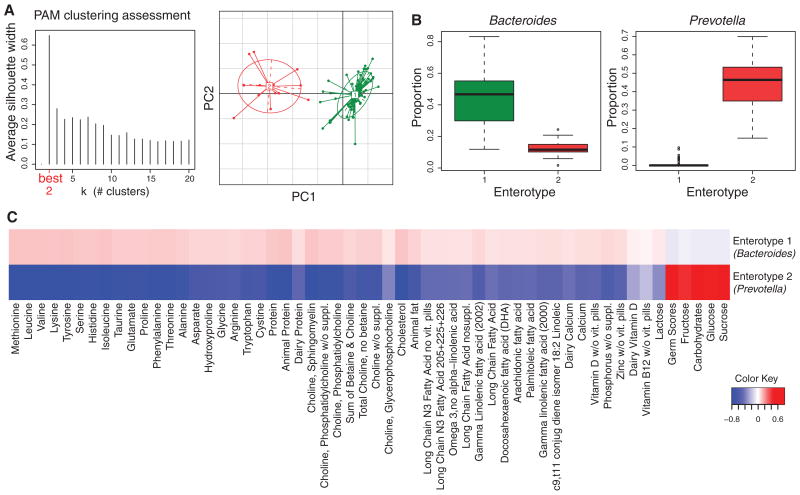
Fig. 2.
Clustering of gut microbial taxa into entero-types is associated with long-term diet. (A) Clustering in the COMBO cross-sectional study using Jensen-Shannon distance. The left panel shows that the data are most naturally separated into two clusters by the PAM method. The x axis shows cluster number; the y axis shows silhouette width, a measure of cluster separation (12). The right panel shows the clustering on the first two principal components. (B) Proportions of bacterial taxa characteristic of each enterotype. Boxes represent the interquartile range (IQR) and the line inside represents the median. Whiskers denote the lowest and highest values within 1.5 × IQR. (C) The association of dietary components with each enterotype. The strength and direction of each association, as measured by the means of the standardized nutrient measurements, is shown by the color key at the lower right. Enterotype is shown at the right. Red indicates greater amounts, blue lesser amounts of each nutrient in each enterotype (complete lists of nutrients are in table S2). Columns were clustered by Euclidean distance.

