
Figure 1.
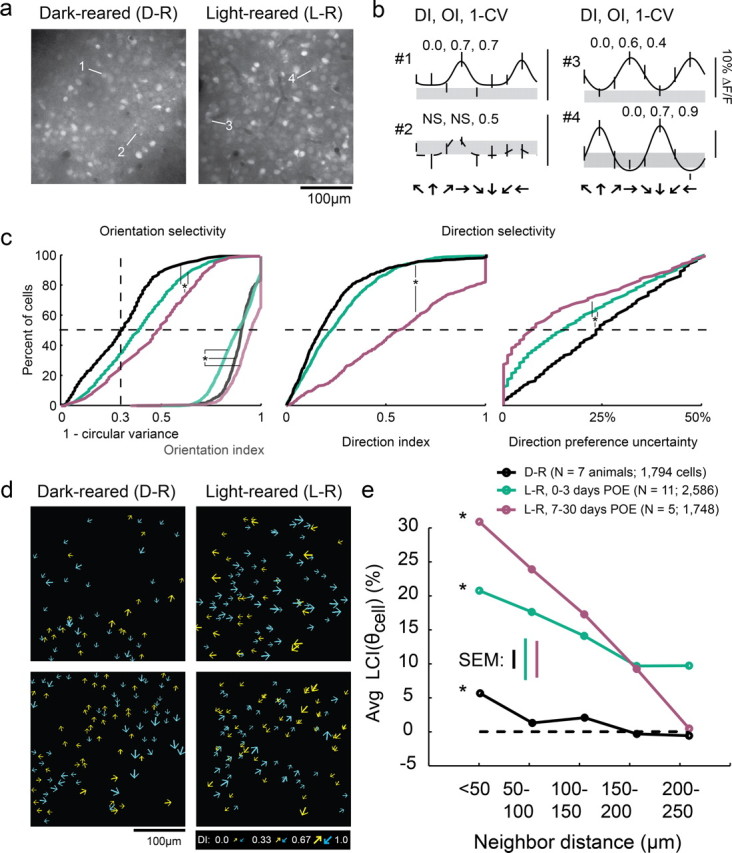
Weak local direction biases are present in dark-reared animals. a, Fluorescent imaging fields of neurons loaded with the calcium indicator OGB-1 in dark-reared and light-reared animals. b, Tuning curves of cells indicated in a); gray region indicates the response to a blank stimulus (±SEM), error bars indicate SEM; solid curves indicate tuning curve fits to cells exhibiting significant orientation selectivity, dashed curves indicate fits to insignificant cells. Numbers indicate direction index (DI), orientation index (OI), and 1 − circular variance. DI and OI could only be reliably calculated for cells that exhibited significant orientation selectivity (see Materials and Methods). c, Left, 1 − circular variance for all responsive cells (left set of curves), and OI for cells that were significantly orientation-selective (right set of curves); note that OI and 1 − CV are plotted on the same axes. Middle: DI for cells exhibiting significant orientation selectivity. Right, Direction preference uncertainty index; * indicates significant differences (Kruskal–Wallis test, Kruskal–Wallis post hoc, p < 0.05). PEO is days post-eye-opening. d, Plots of direction selectivity of individual cells in dark-reared and light-reared imaging fields. Arrows indicate preferred direction; for visualization, half of direction space is represented by yellow arrows, and the other half by blue arrows; size of arrow indicates strength of DI as indicated in key. e, Local coherence index as a function of neighborhood distance. Both light-reared groups and dark-reared animals exhibited a significant LCI relationship with distance (ANOVA, see Results), although LCI was weaker in dark-reared animals than in light-reared animals that had <3 d of visual experience.