
Figure 4.
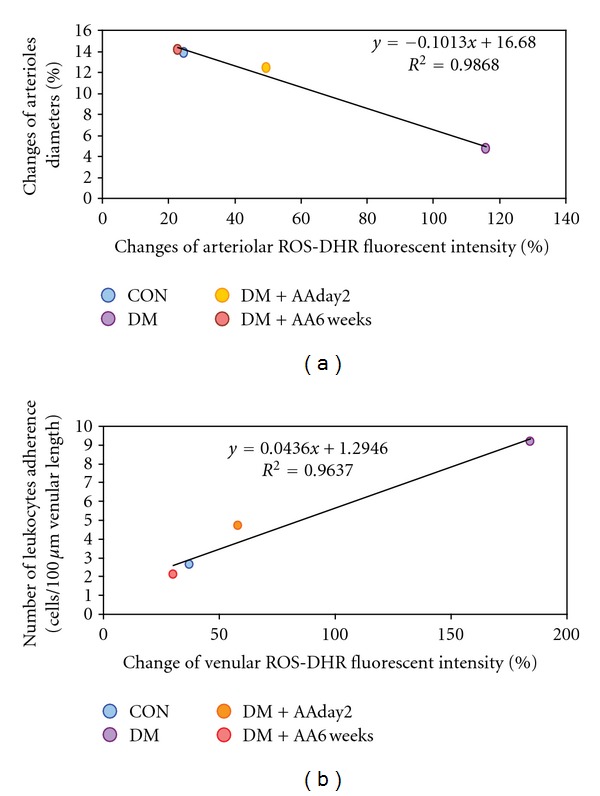
Percentage of changed DHR intensities and number (Cn) of leukocyte-endothelial cell interaction in each group of control (CON), diabetes (DM), diabetes treated with vitamin C (1 g/L) starting on day 2 (DM + AAday2), and on 6 weeks (DM + AA6wk) after STZ injection was plotted. The correlation and regression line were obtained for each group as demonstrated in (a). In (b), the correlation and regression line were obtained for combined data of every group.