Figure 1.
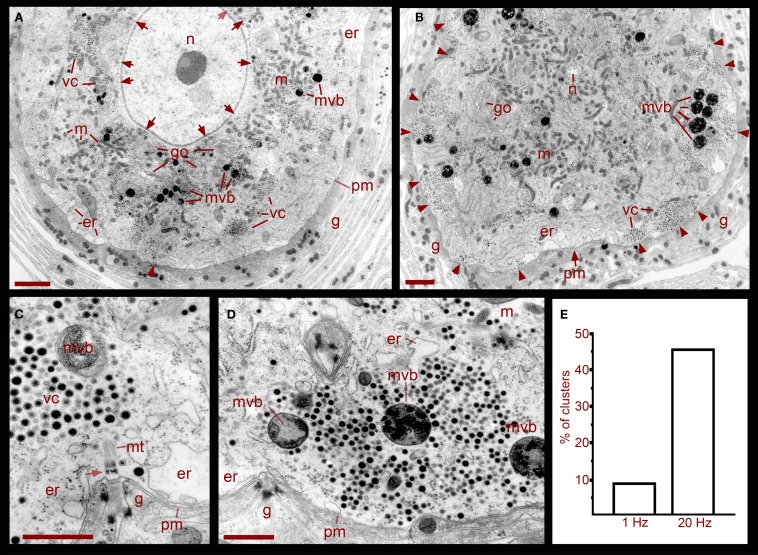
Ultrastructure of the soma of Retzius neurons in relation to somatic exocytosis. (A) Low magnification electron micrograph of a neuron that had been stimulated at 1 Hz, a frequency that fails to evoke somatic serotonin exocytosis. Vesicle clusters located around the nucleus (n) are indicated with arrows. Clusters in the region midway between the nucleus and the plasma membrane are indicated as vc. Vesicle clusters and multivesicular bodies (mvb) are absent in the peripheral cytoplasmic area next to the plasma membrane. Some multivesicular bodies are interspersed within the vesicle clusters. Golgi apparatuses (go) are also more concentrated around the nucleus. Mitochondria (m) are near vesicles and endoplasmic reticulum (er) are located near the plasma membrane (pm). The arrowhead points to microtubule bundle arriving at the plasma membrane. The neuron is surrounded by layers of the giant glial cell (g). Scale = 2 μm. (B) Electron micrograph of a neuron stimulated at 20 Hz. A majority of the vesicle clusters are apposed to the plasma membrane (arrowheads). Multivesicular bodies lie within peripheral vesicle clusters and mitochondria can be seen around them (small arrows). Note that even after stimulation, vesicle clusters remained near the nucleus (n). Scale = 2 μm. (C) Magnified electron micrograph of a peripherally located vesicle cluster in a neuron that had been stimulated at 1 Hz. Vesicle clusters are located away from the plasma membrane and the intermediate space contains endoplasmic reticulum. A bundle of microtubules (mt) extends from the vesicle cluster vesicles to a hemi-desmosome (arrow) apposed to an invagination of the plasma membrane (arrowheads). Glial cell fingers characteristic of these structures penetrate into the somatic invagination. Scale = 1 μm. (D) Magnified electron micrograph of a neuron stimulated at 20 Hz. A vesicle cluster is apposed to the plasma membrane near an invagination (arrowheads). Vesicle rows formed radial arrays with multivesicular bodies. Scale = 1 μm. (E) Graph of the percentage of vesicle clusters apposed to the plasma membrane in neurons stimulated at frequencies of 1 vs. 20 Hz. Individual clusters were identified and counted from digital images low magnification and scanned at high resolution such as those in (A) and (B). As seen in (C,D), this vesicle cluster counting could be done easily since the clusters are self-delimited and they only contain vesicles and multivesicular bodies.

