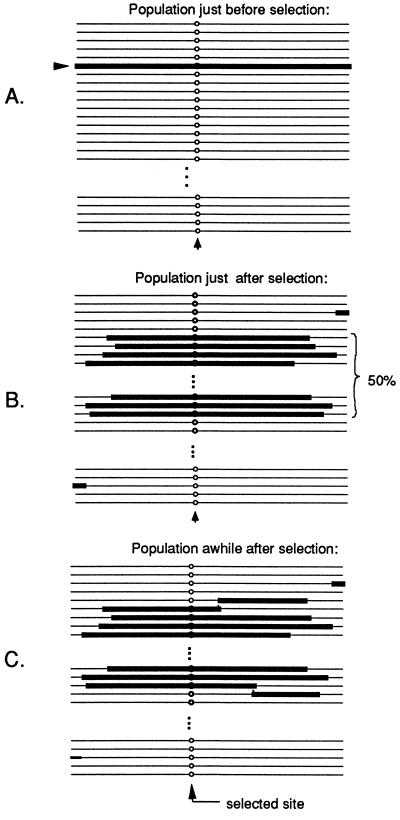
Figure 2.
Representation of the pattern of variation in a population of chromosomes just before (A), just after (B), and some time after (C) a partial selective sweep in which a mutation is rapidly driven to a frequency of 50% by natural selection. The site where selection acts is designated by a circle. The parts of chromosomes highlighted by a thick line indicate segments that are descended from the chromosome on which the original mutant arose.

