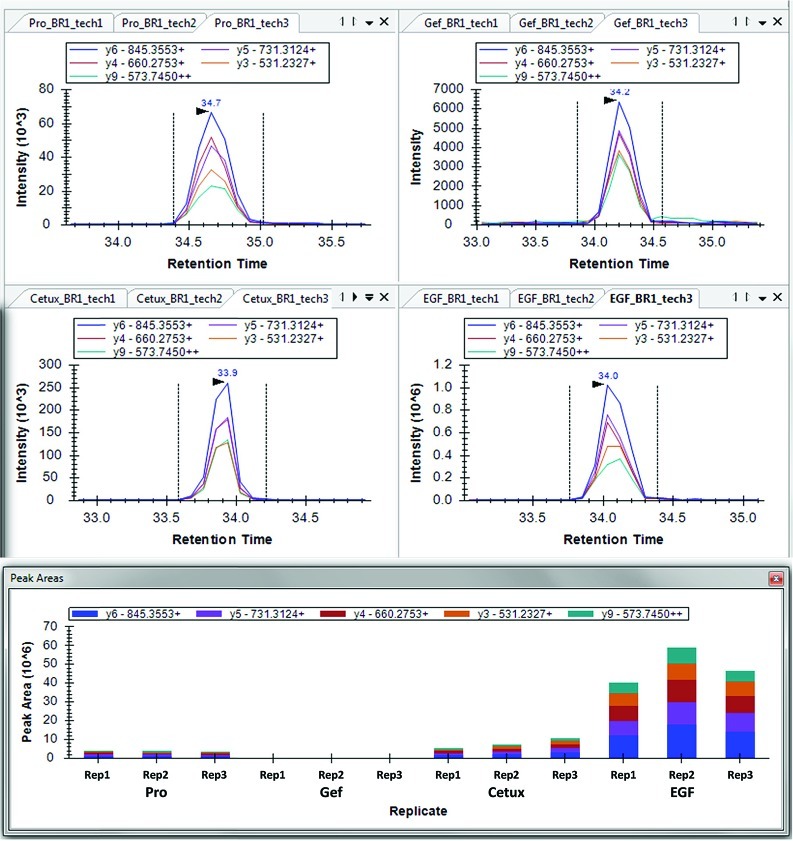
Figure 6.
Skyline display from replicate peak areas and imported targeted MS/MS data to produce pSRM traces for GSTAENAEpYLR from A431 cells not treated (proliferating), modulated with EGF, or cotreated with inhibitor (cetuximab or gefitinib) followed by EGF. Samples were acquired using a Thermo Fisher LTQ-Velos. Replicate peak areas show the reproducibility of the peaks and their composition from the pSRM traces.

