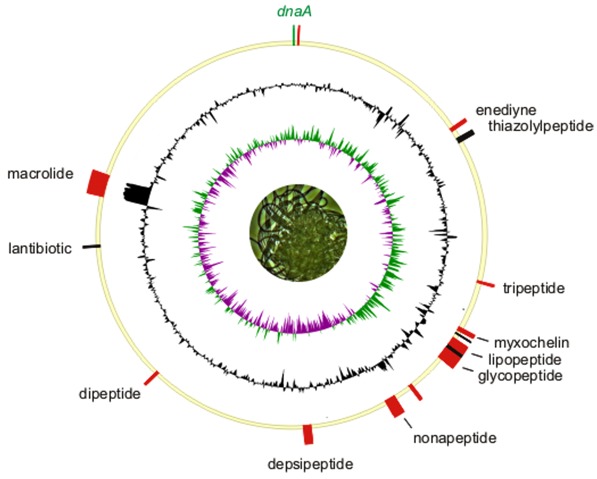
Figure 6.

Chromosome of H. aurantiacus strain 114-95T oriented to the dnaA gene (top). The inner ring shows a normalized plot of GC skew, while the center ring shows a normalized plot of GC content. The outer circle shows the distribution of secondary metabolite gene clusters. Biosynthetic gene clusters associated with thiotemplate-based assembly (PKS, NRPS) are depicted in red and bacteriocin loci are marked in black.
