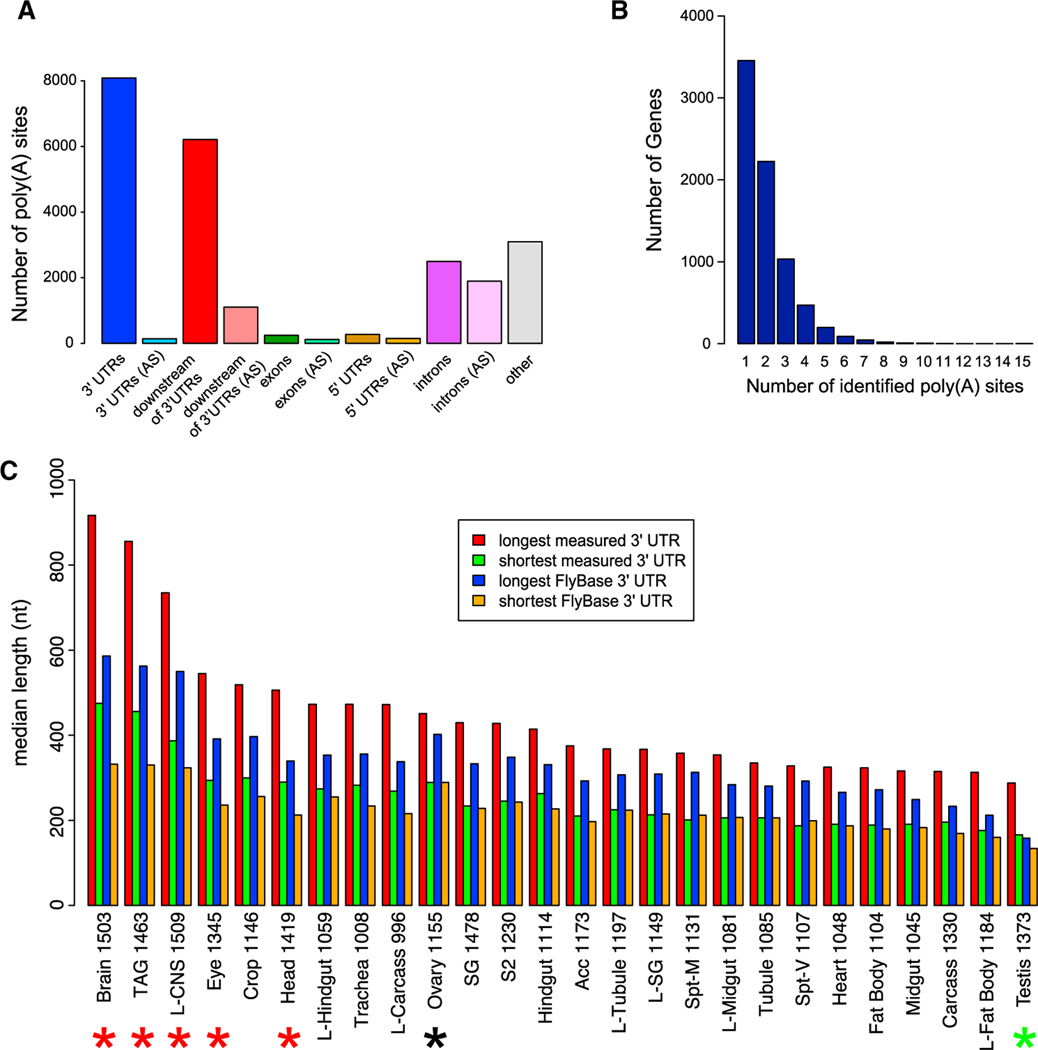
Figure 1. Poly(A)-Spanning RNA-Seq Reads Reveal Tissue-Specific Differences in 3′ UTR Length.
(A) Distribution of poly(A) sites, minimum two reads per cluster, with respect to gene annotations. AS, antisense.
(B) Distribution of 3′ UTR isoforms per gene. A cluster of two or more poly(A)-spanning reads downstream of a stop codon is classified as a poly(A)-supported 3′ end.
(C) Distribution of 3′ UTR median length (using minimum two reads per cluster) with respect to FlyAtlas gene classifications. For “longest measured 3′ UTR” and “shortest measured 3′ UTRs,” poly(A)-spanning reads downstream of annotated 3′ ends and before the adjacent gene, and reads upstream of the annotated 3′ end, but after the stop codon were attributed to that gene. Lengths of longest and shortest 3′ UTRs from the FlyBase annotations of the same genes are shown for comparison. Note that nervous system tissues (highlighted with the red asterisks) have the longest 3′ UTRs as predicted by the poly(A)-spanning reads, whereas testis has the shortest 3′ UTRs (green asterisk); ovaries (highlighted with a black asterisk) have 3′ UTRs of intermediate length. The numbers after the tissue indicate the number of genes in each category. Acc, male accessory gland; prefix “L”, larval tissue; SG, salivary gland; Spt-M, mated spermatheca; Spt-V, virgin spermatheca; S2, S2 cells; TAG, thoracicoabdominal ganglion.

