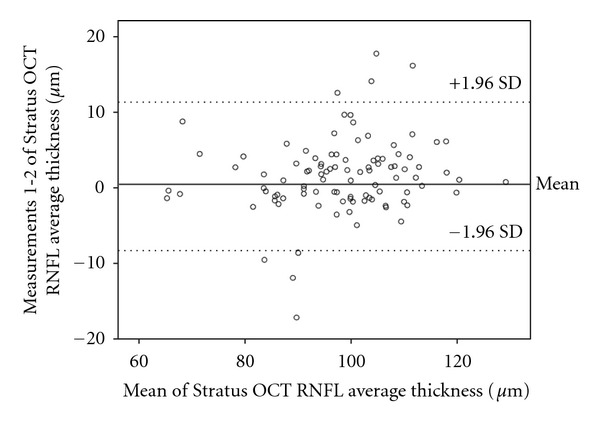
Figure 3.

Bland-Altman plots of the agreement in retinal nerve fiber layer (RNFL) thickness between Stratus OCT measurement 1 and measurement 2. The difference (Stratus OCT average RNFL thickness measurement 1 minus Stratus OCT average RNFL thickness measurement 2) was plotted against the average of the three measurements for the average RNFL thickness Stratus OCT measurements. SD: standard deviation.
