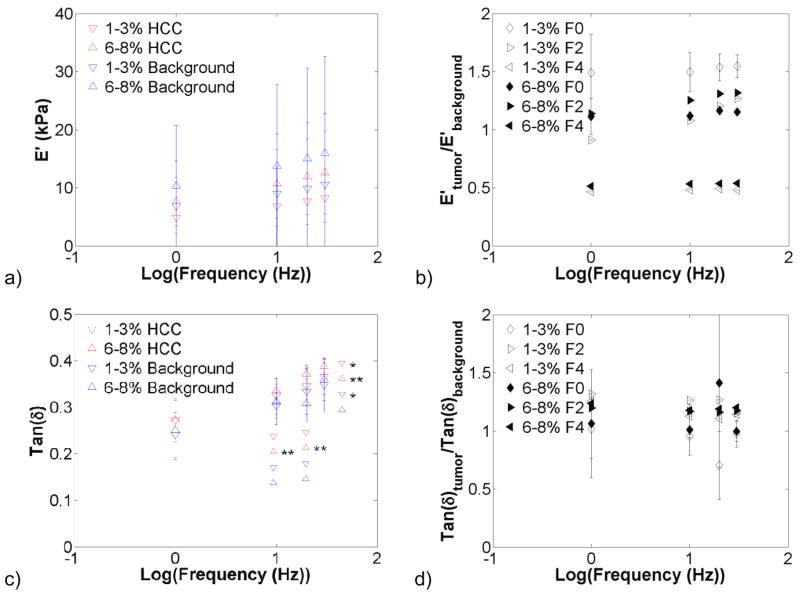
Figure 7.
Effects of testing frequency on hepatocellular carcinoma (HCC) and surrounding background viscoelastic properties (n = 4). Graphs present the storage modulus (a), modulus contrast (b), tan(δ) (c), and tan(δ) contrast (d) for the 1–3% and 6–8% compression ranges. Increases in frequency increased the storage modulus and tan(δ) (*, p<0.05; **, p<0.001). Storage modulus and tan (δ) contrast remained relatively constant with increases in frequency. Note: symbols to the left of the asterisks indicate statistical significance only – i.e. they are not actual data points.

