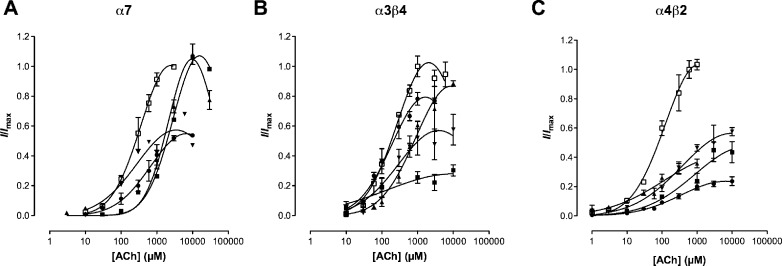
Figure 2.
Concentration−response curves for ACh alone (◻) and ACh in the presence of compounds (30 μM) 2 (▲), 3 (●), 4 (◼), and 5 (▼) at (A) α4β2 normalized to 1 mM ACh (B) α3β4 normalized to 1 mM ACh and (C) α7 normalized to 10 mM ACh with a 3 min preincubation period. Data are presented as the mean ± SEM (n = 3 − 15 oocytes). All compounds studied were NCAs (represented by a significant drop in Imax and no significant rightward shift of the ACh EC50) at α4β2 and α3β4 nAChRs albeit compound 2 was previously reported (14) to have mixed competitive and noncompetitive properties as there was both a drop in Imax and shift in EC50 (Table 1). At α7, only compounds 3 and 5 were noncompetitive, while compounds 2 and 4 exhibited competitive rather than noncompetitive effects.

