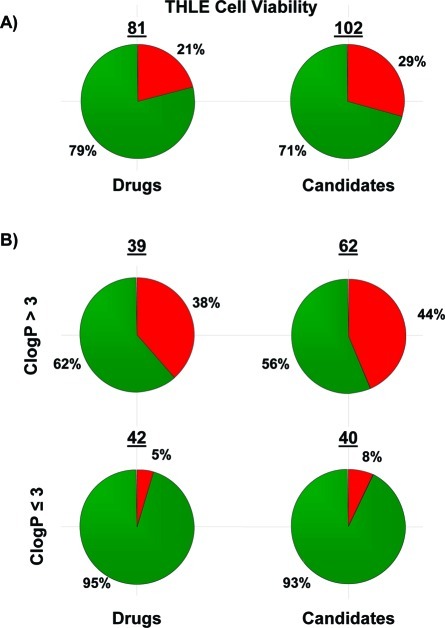
Figure 10.
Distribution of THLE Cv of drugs and candidates as measured by an ATP depletion assay. Results are color-coded by high cell viability (IC50 > 100 μM, green) and low cell viability (IC50 ≤ 100 μM, red). (A) Overall distribution of THLE Cv for the drug and candidate set. (B) Segregation of THLE Cv data into high and low lipophilicity bins.

